
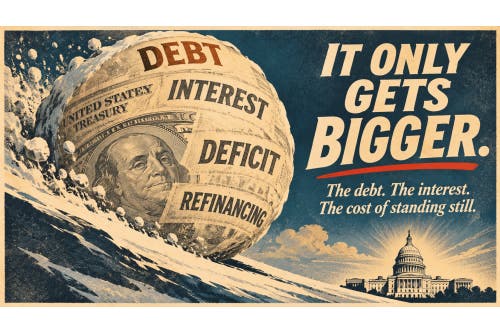
A new Congress takes office in January. It inherits a budget in which the single fastest-growing line item is one no member of Congress will ever vote on.
Net interest payments on the national debt reached $1.05 trillion in fiscal 2026, up 8%, while revenue grew 3% to $5.4 trillion and spending grew 6% to $7.4 trillion. Interest is outrunning the economy, outrunning revenue, and outrunning the budget it belongs to.
The same week those numbers landed, the World Gold Council reported that central banks had bought another 321 tonnes of gold.
Those two facts are the same story.
What a dollar has done
A dollar today buys a small fraction of what it bought a century ago. That's the Bureau of Labor Statistics' own measurement, available in a public calculator anyone can check in thirty seconds.
The consistency is what matters more than the number. There is no four-year stretch in modern American history during which the dollar gained purchasing power. Not under any administration, not under any configuration of Congress, not in war or peace, expansion or recession, surplus or deficit. A trend that survives every political arrangement a country can produce isn't a political phenomenon. It's the operating characteristic of the currency.
What changed recently isn't the direction. It's the rate of change in the machinery underneath it.
2022: The Year the Assumption Broke
For decades, holding dollars was simply what "reserves" meant. Two things in 2022 forced every finance ministry on earth to re-examine that.
The first was monetary: the post-COVID expansion of the money supply working its way through the system and into prices.
The second was structural. A new category of financial sanctions demonstrated that dollar reserves could be frozen — that a sovereign nation's savings were held at another government's discretion. Whatever you think of the policy, every reserve manager in the world drew the same operational conclusion.
The response shows up in the data with unusual clarity. Central bank net gold purchases ran 1,082 tonnes in 2022, 1,037 in 2023, 1,092 in 2024, and 863 in 2025 — against an annual average of 473 tonnes from 2010 through 2021.
Roughly double the prior decade's pace, sustained for four consecutive years. That isn't a trade. It's a reallocation.
The Line Item Nobody Votes On
Here's what the incoming Congress is walking into.
The federal government paid $1.052 trillion in net interest in fiscal 2026 — more than it spent on defense, and the third-largest outlay after Social Security at $1.67 trillion and Medicare at $1.07 trillion. Gross interest came to $1.36 trillion. That's about $2.9 billion a day.
Net interest hit an estimated 3.3% of GDP in 2026, a record high. The 50-year historical average is 2.1%. That $1 trillion equals roughly 19% of all federal revenue collected.
Nearly a fifth of every dollar the government takes in goes to servicing money already borrowed, before a single program is funded.
Interest is categorically unlike every other line in the budget. Defense can be cut. Programs can be reformed, delayed, means-tested, restructured. Interest cannot be negotiated, deferred, or legislated away. It is not a policy choice. It is a bill that arrives on schedule, in an amount set by decisions already made, payable by a government that borrows to pay it.
The fiscal 2026 deficit came in at $1.99 trillion, up 12% from $1.78 trillion the prior year.
The Part Most Coverage Misses
The debt doesn't sit still at a fixed rate. It gets refinanced.
About one-third of publicly held debt — more than $10 trillion — matures within the next twelve months, meaning the government must roll it over at today's rates.
Much of that was issued when borrowing was nearly free. The average interest rate on gross interest costs now sits at 3.53%, more than double the 1.6% of 2021. Every maturing bill and note that gets reissued at current rates resets the government's cost structure upward, permanently, with no vote taken and no announcement made.
And the rate environment is running ahead of the official forecasts. The 10-year Treasury yield is now above 5%, past CBO's projections of 4.1% for this year and 4.4% out through 2036. If yields stay about a percentage point above CBO's estimates, the Committee for a Responsible Federal Budget projects interest costs reaching $2.8 trillion, or 5.9% of GDP, by the end of the decade.
That's the compounding loop stated plainly. Interest crowds out other spending. Crowded-out spending makes consolidation harder. Harder consolidation means more borrowing. More borrowing raises interest. Each rotation makes the next one worse, and none of it requires anyone to act.
Breaking the cycle would mean touching mandatory programs or raising revenue substantially. Both end careers. Social Security's trust fund math has been public and unaddressed for thirty years. The incoming Congress is split, which means the next two years will produce continuing resolutions, appropriations standoffs, and debt ceiling fights. The $2.9 billion a day accrues through every one of them.
The Divergence Happending Right Now
This is where it gets interesting, and where the honest version is more compelling than the pitch.
Gold is well off its highs. The record was $5,589.38 on January 28 of this year. It's trading near $4,045 this morning. October was its worst since 2008, down 6.7%. Anyone who bought at the peak is underwater.
Through that entire decline, the institutional buying did not stop.
Central banks bought 321 tonnes in Q3, eclipsing recent quarterly levels and lifting year-to-date demand to 675 tonnes, up 6% year-over-year. The World Gold Council expects full-year buying to at least match 2025. In its 2026 survey of 76 reserve managers — the largest participation in the survey's nine-year history — 89% expect global central bank gold holdings to rise over the next twelve months. Gold ETF holdings hit a record 4,256 tonnes after 211 tonnes of net inflows in Q3.
And retail? Bar and coin demand fell 19% year-over-year to 268 tonnes as investors waited for a clearer price trend to emerge.
That's the whole picture in three data points. Sovereign buyers accumulating through a 28% drawdown. Institutional vehicles at record holdings. Individual buyers stepping back and waiting for confirmation.
The institutions with the best information and the longest horizons are not waiting for a clearer trend. They have one.
The Conditions Aren't Improving
Growth is sluggish. Active conflicts span multiple theaters with no resolution in view, and energy prices have moved with them. AI is reshaping employment faster than policy can respond, with consequences for consumer demand and the tax base that nobody has modeled credibly. Social Security remains unfixed, with the arithmetic known and the political will absent.
Set that against deficits running near $2 trillion, interest compounding at $2.9 billion a day, and $10 trillion rolling over into higher rates in the next twelve months.
None of that is a forecast. All of it is on the record.
The Default Position Is a Position
Holding dollars feels neutral. It isn't. It's a concentrated position in a currency with a hundred-year record of losing purchasing power, held at the moment the structural drivers of that loss have grown past the reach of ordinary politics — and held against the revealed behavior of nearly every central bank on earth since 2022.
This isn't a prediction about next quarter's price. Predictions about gold have been made and broken for decades, usually by people with something to sell, and the last ten months are a reminder that it moves both ways.
It's an observation about direction, duration, and the absence of any mechanism to change either. The sovereign buyers moved three years ago and haven't stopped. The individual buyer, by the World Gold Council's own measurement, is the one still on the sidelines.
Posting in:
 byUnited States Gold Bureau